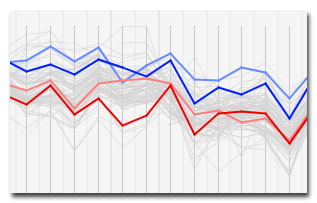
Analyzing time series
With SurveyVisualizer data from different can be compared with each other in the next few years. In Toolbar are the available years performed. To display the values of a year, click on the corresponding year. If no year is selected, the following appears in graphics area no lines.
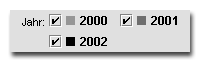
If you select several years, the lines that belong to belong to different years of a single analysis element automatically displayed in graded lighter shades. This simplifies the comparison of values from different years.